
Here we present the first growth charts for children with Bohring-Opitz Syndrome.
» View the BOS GROWTH CHARTS as pdf
Aims
Growth in children with Bohring-Opitz Syndrome (BOS) is different from healthy children. Children with BOS are characterized with IUGR (Intrauterine Growth Retardation) and severe feedings problems, as well as failure to thrive. With this in mind, we think it is important to take a different view on the growth of children with BOS. Due to the limited published knowledge about BOS, often the expectations of how these children “have to grow” and the concerns and pressure on parents and caregivers if they didn’t reach the World Health Organization (WHO) standards can be overwhelming. We hope that this research initiates more investigation with a greater amount of participation from professionals in the medical field.
Methods
The results are based on an online survey “Growth Charts for Children with Bohring-Opitz Syndrome.” We gave parents and caregivers of children with BOS, who are united in our support group, the opportunity to contribute to this online survey.
In the survey we asked for the gender of the child and how he/she was diagnosed with BOS. We also asked for the length and weight of the child at birth to two years, at the ages of three, six, nine, twelve, eighteen and twenty four months. These records were compared with the data of the WHO Child Growth Standards [1].
Results
The survey was visited 38 times. Seven responses were complete, 26 incomplete. From these 26 incomplete responses, five responses were included in the growth chart study.

A total of five girls and seven boys with Bohring-Opitz Syndrome contributed. This represents approximately 15% of known children with BOS. Of the study group, one child was clinically diagnosed with BOS and all the others tested positive with the mutation on the ASXL1 gene.


The graph reveals that the birth weight results for the BOS boys and girls alike were relatively similar. The documented birth weights of the boys ranged between 2,000 and 3,000 grams, and the documented birth weights of the girls ranged between 2,000 and 2,500 grams. However, there is some variation in the results shown in ‘weight for age’ when comparing BOS boys and girls. Contrary to the ‘weight for age’ data for BOS girls, the data for BOS boys shows a wide range in ‘weights for age’ after the age of 12 months. At the age of 18 months, the weight values are between 3,500 and 10,400 grams. It is important to note that the weight gain documented for one boy hardly changed within the first two years of life. The difference in weight values for BOS girls at the age of 18 months is only about 1,500 grams.


The ‘length for age’ curve, for both BOS boys and girls alike, follow a rising line trend. With one exception the weight values are also relatively close together.

We also compared the average ‘height for age’ and ‘weight for age’ values of BOS boys and girls with the ‘WHO Child Growth Standards.’
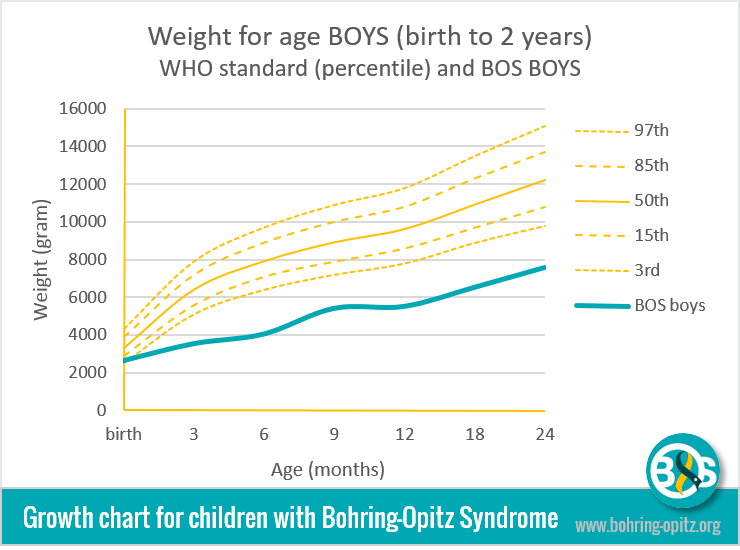

Although the ‘weight for age’ growth curves for both BOS boys and girls are well below the 3rd percentile when compared to the ‘WHO Child Growth Standards,’ the BOS boys and girls growth curves follow in a steady rising trend.


The BOS boys and girls ‘length for age’ growth curves also fall below the 3rd percentile on the ‘Who Child Growth Standards” chart, however, the lengths documented follow a steady upward trend. Similar to the ‘weight for age’ curve, the average birth length curve is relatively close to the 3rd percentile of the ‘WHO Child Growth Standards’.


One can also analyse the growth of children by looking at the proportion of weight and length at different ages. Our data shows that there is not much divergence between BOS children and healthy children on the ‘weight for length’ curve.
Even though the birth weight and length results for BOS boys are between the 85th and 97th percentile and slightly below the 3rd percentile at the age of 24 months on the WHO standard chart, the ‘weight for length’ curve for BOS girls follows a steady upward trend within the 50th percentile on the WHO standard chart.
Conclusion
The outcome is not surprising for parents and caregivers of children with Bohring-Opitz Syndrome. The measurements (weight and length) for girls, as well as boys, are well below the 3rd percentile when comparing the data to the ‘WHO Child Growth Standards.’
However, due to the fact that there are very few Bohring-Opitz Syndrome children known, and given the low participation in this survey, we are not able to make reliable conclusions. Nevertheless, the growth curves show that the weights and lengths of BOS children are, without exception, much lower in comparison to the WHO standards. Therefore, there may be multiple reasons for this phenomenon: IUGR (Intrauterine growth restriction), failure to thrive due to common severe feeding intolerance, cyclic emesis, recurring infections, multiple surgeries, the recovery of which can have a delayed growth impact on children with Bohring-Opitz Syndrome. Other possible causes, such as metabolic disorders, are still unexplored.
Growth charts that are specific to children with Bohring-Opitz Syndrome could become important tools for routine medical follow up, as well as during monitoring when undergoing growth promoting treatments.
Acknowledgements
We thank the children and their parents for participation in this study.
Source
Online Survey ‘Growth chart children with BOS’, http://bohringopitzsyndrome.polldaddy.com/s/growth-chart-children-with-bos,
June 15th, 2015 – January 15th, 2016.
The WHO Child Growth Standards, http://www.who.int/childgrowth/standards/en/, December 30th, 2015.
[1] The WHO Child Growth Standards http://www.who.int/childgrowth/standards/en/ 30 December 2015
